Prescription drug monitoring programs and opioid prescribing
Explainer of Shakya et al. (2023), Contemporary Economic Policy. Not the journal article.
Citation: Shakya, S., & Ruseski, J. (2023). The effect of prescription drug monitoring programs on county-level opioid prescribing practices and spillovers. Contemporary Economic Policy, 41(3), 435-454. DOI. Free PDF
Facts below were checked against the published CEP manuscript in the Overleaf project PDMP-County (BodyPage-CEP.tex) and the journal abstract.
Facts
Main finding
Counties in must-access PDMP states dispense about 5.5 fewer retail opioid prescriptions per 100 persons than counties in voluntary-access states (border-contiguity specification). A simpler county-and-year fixed-effects comparison finds a larger drop of about 8.5 per 100 persons. Must-access counties that share a border with a voluntary-access county see a larger drop (about 7 fewer per 100 persons) than interior counties in the same must-access states. That pattern is consistent with cross-border shopping. The extra prescribing on the voluntary-access side of the border appears in the immediately adjacent counties, not further inland.
One caveat
The data do not split prescriptions by drug, dose, or patient risk, so the paper cannot say whether the drop is concentrated among high-risk fills. Must-access rules also differ across states (who may query, how fast pharmacies report, which schedules are covered), and this study treats the mandate as a single on/off policy. IQVIA leaves some counties blank. A blanket query rule can also restrict opioids for people who need them for pain.
Policy hook
Voluntary prescription drug monitoring programs (PDMPs) are electronic databases of controlled-substance fills. Prescribers often skip them: by the end of 2013, only 22% of licensed prescribers were registered. Most states responded with “must access” rules that require checking the database before prescribing drugs with misuse potential. The policy question is whether those mandates actually cut retail opioid dispensing, and whether they just push patients across the state line.
Data and setting
US counties, 2010-2017 (25,120 county-year observations). The outcome is CDC estimates of retail opioid prescriptions dispensed per 100 persons, from IQVIA Xponent (about 50,000 retail pharmacies covering nearly 90% of US retail prescriptions). The series includes initial and refill fills paid by commercial insurance, Medicaid, Medicare, or cash. It excludes mail-order pharmacies, cough and cold opioid products, most buprenorphine products used for opioid use disorder, and methadone from opioid treatment programs. Must-access dates come from the Prescription Drug Abuse Policy System (PDAPS): whether the state requires prescribers to check the PDMP before prescribing controlled substances. Kentucky, New Mexico, and West Virginia adopt in 2012; New Hampshire and Rhode Island are the last adopters in the sample (2016).
Research design (plain language)
The paper uses staggered adoption of must-access mandates in a difference-in-differences design with county and year fixed effects. To reduce the worry that high-prescribing states are the ones that adopt mandates, it then compares counties on either side of a state border: must-access interior counties, must-access border counties, neighboring voluntary-access border counties, and other counties. Standard errors are clustered at the state and year level. Checks include other opioid-related state laws and Medicaid expansion, a double-selection LASSO for county covariates, a Goodman-Bacon decomposition of staggered timing, event studies (two-way fixed effects and Sun and Abraham 2021), and a placebo that randomizes must-access dates 1,000 times.
PDF or DOI
Figures
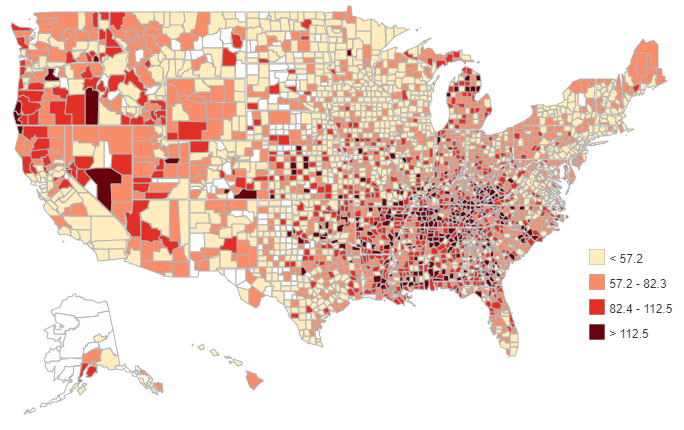
Figure 1:Retail opioid prescriptions dispensed per 100 persons, 2017. Darker counties have higher rates. White counties have no IQVIA Xponent data (no retail pharmacy in the sample, or volume attributed to a neighboring county). Source: CDC.
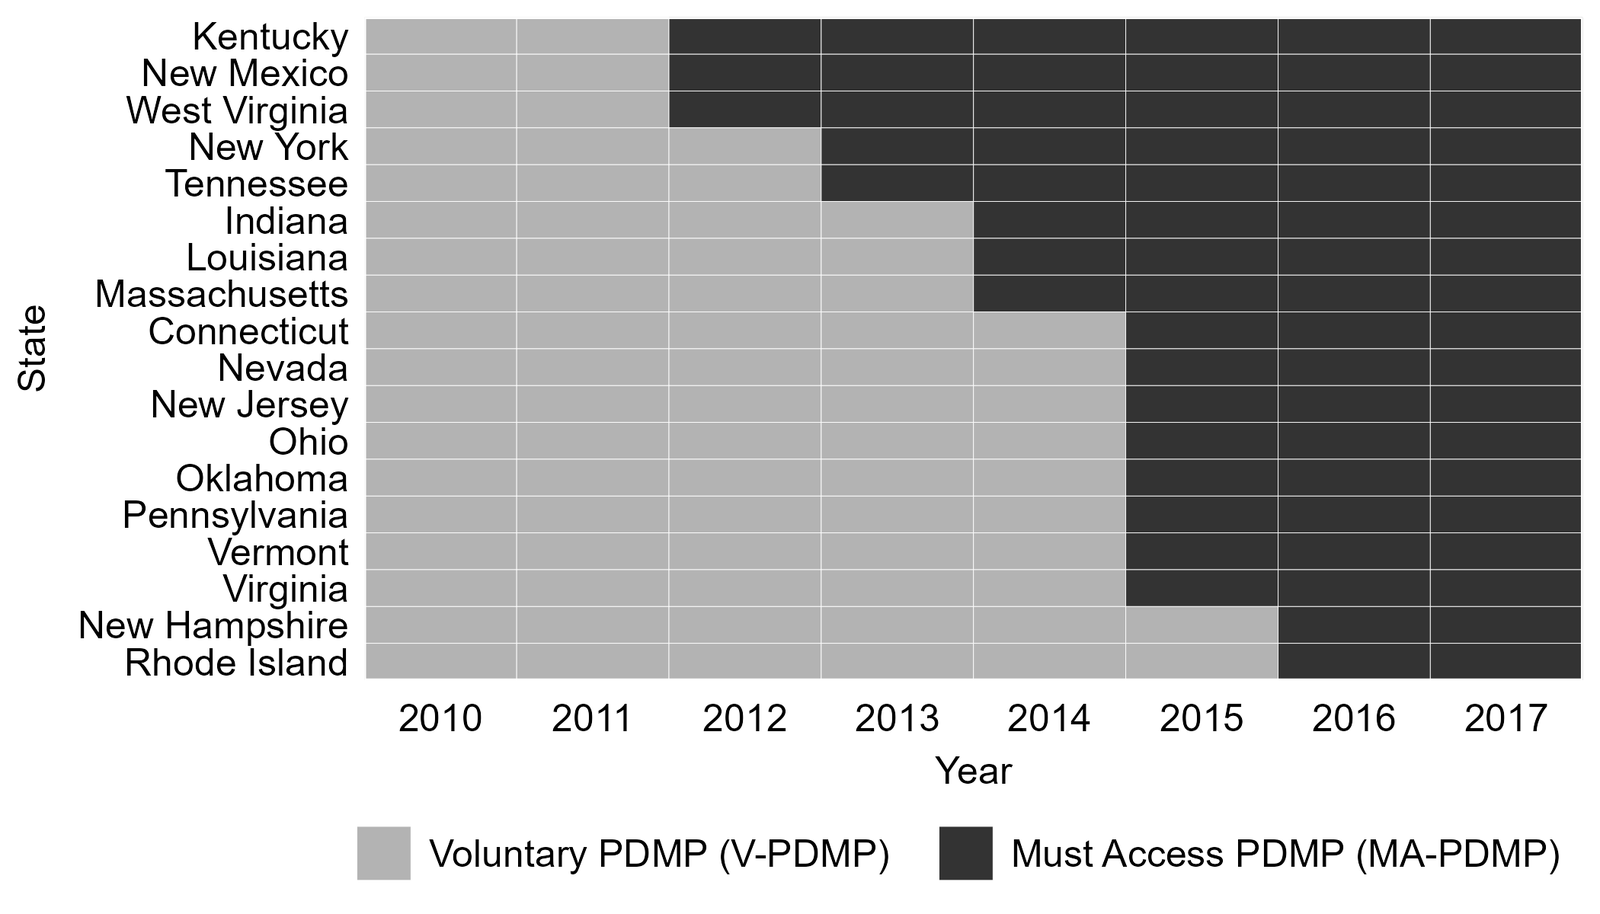
Figure 2:When states moved from voluntary PDMP (light) to must-access PDMP (dark), 2010-2017. This staggered timing is the identifying variation. Other states in the sample keep voluntary access throughout, except Missouri, which did not have a statewide PDMP. Source: PDAPS.
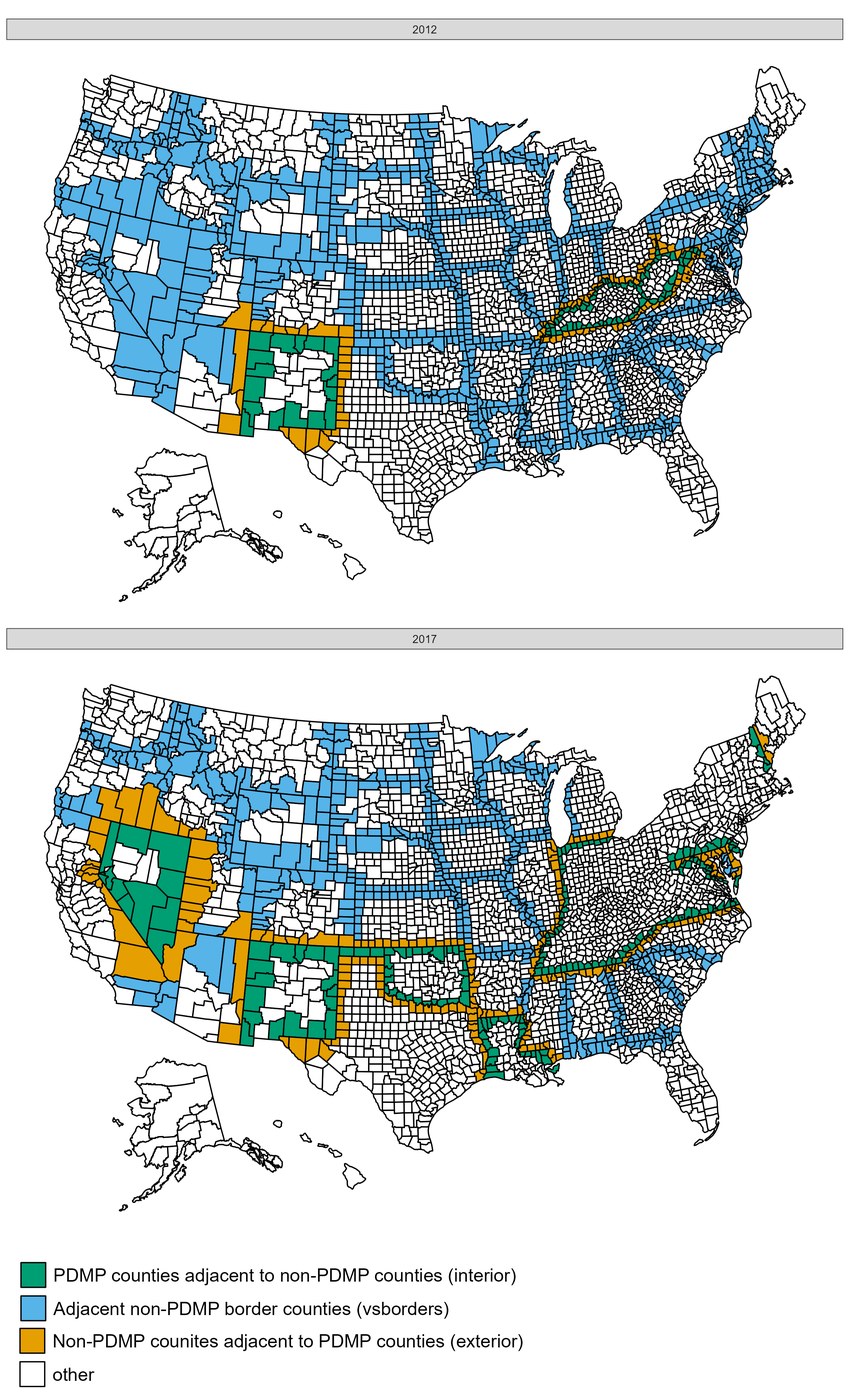
Figure 3:County border types used in the spillover design, 2012 (top) and 2017 (bottom). Green: must-access counties next to voluntary-access counties. Gold: voluntary-access counties next to must-access counties. Blue: other voluntary-access border counties. White: remaining counties. By 2017 the must-access and voluntary-access border is longer, especially in the East.
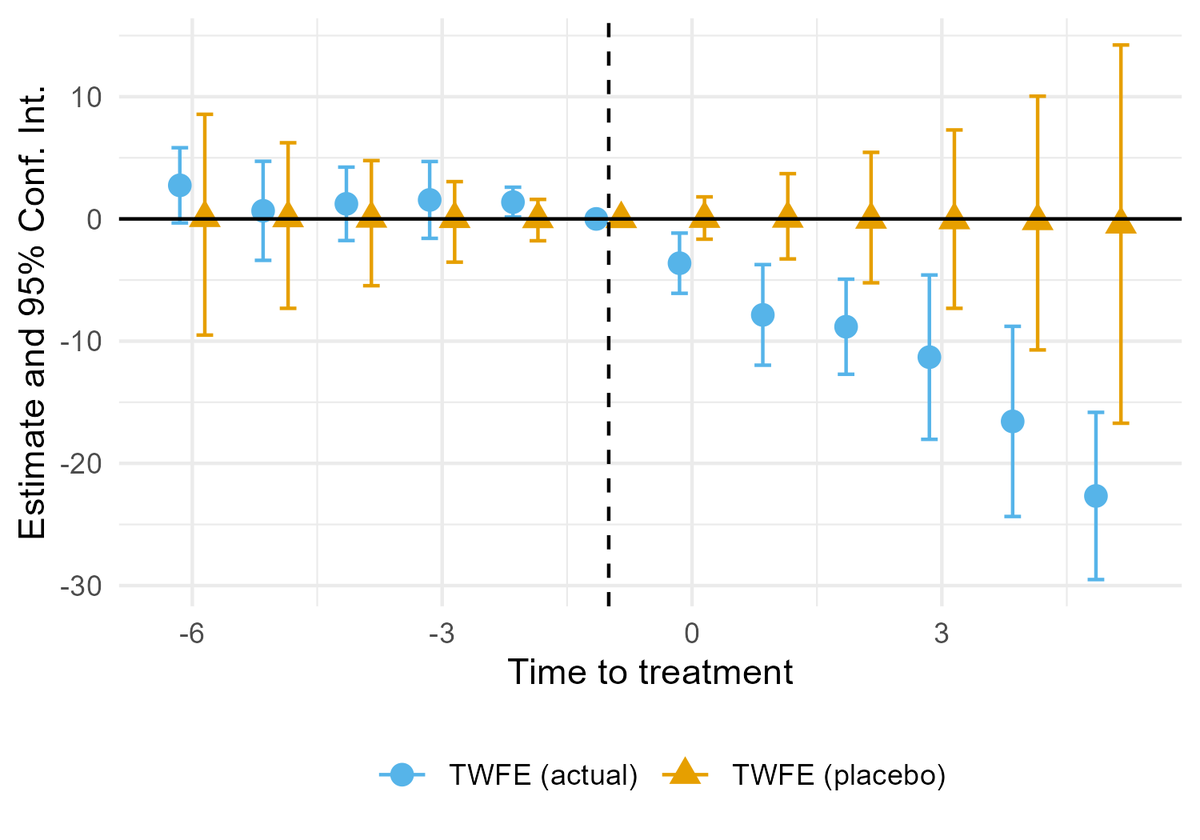
Figure 4:Event study, two-way fixed effects. Blue markers are estimated effects relative to must-access adoption (period 0). Orange markers show a placebo distribution from randomizing adoption dates. Pre-period estimates sit near zero. After adoption, prescribing falls and stays below the placebo band.
:::{grid-item}
:::{figure} images/event-study-sun-abraham.png
:label: fig-pdmp-sun-abraham
:alt: Event-study plot with the Sun and Abraham correction, again showing little pre-trend and a decline in prescribing after must-access adoption.
:width: 100%

Same event study with the Sun and Abraham (2021) correction for staggered timing. The pattern is the same: little pre-trend, then a persistent decline in retail opioid prescriptions per 100 persons.
Why it matters
Must-access PDMPs are a core state tool against opioid overprescribing. This paper shows they reduce retail opioid dispensing at the county level: about 5.5 fewer prescriptions per 100 people than in voluntary-access states. Geography still matters. When a must-access county sits next to a voluntary-access neighbor, the drop is larger on the must-access side of the border, which is consistent with people crossing the line to fill prescriptions where checking the database is not required. A mandate that stops at the state line can be partly undone by a short drive, so interstate PDMP data sharing is a natural complement. The same results caution against a one-size-fits-all query rule: a blanket mandate can restrict opioids for people who need them for pain, not only for high-risk use.
- Shakya, S., & Ruseski, J. E. (2023). The effect of Prescription Drug Monitoring Programs on county‐level opioid prescribing practices and spillovers. Contemporary Economic Policy, 41(3), 435–454. 10.1111/coep.12607